


This technique and the examples at the bottom of this article are straight from my trading journal. They’re not hypothetical, they are live trades I’ve taken, and some of you reading this have watched me do it live via Trader Dale’s Funded Trader Academy.
In part 1 of this series “Trading the Volume Profile” I covered the basics of a volume profile. The anatomy, different profile compositions & their implications, as well as introducing you to framing a market for the next trading day using daily volume profiles. If you missed that article or don’t know the volume profile, you can catch it here and quickly get up to speed:

I’m going to go further into the profile and introduce the concept of capturing value shifts using the volume profile. Its a technique I use daily to find the highest probable breakout and breakdown locations from typically the prior 2-5 days data, and I do this usually 30 minutes before the opening bell. After the day is framed, I then look for very specific cash session setups and criteria to trigger an entry once price arrives at those levels.
(Concept of shifting value shown below)
Value, like price, can only go one of three ways day to day. It can go up, down or range sideways. There’s no fourth option. Looking at things from a value perspective broadens your view just a bit and can keep you focused on the bigger picture vs simply chasing the latest bar to bar surge.
Each of these levels derived from the volume profile tend to act as magnets to price. POC, VAH, VAL, Prior session high, Prior session low and I’ll throw in overnight high and low as well, even though they are not part of the VP (if you don’t know these terms, please read “Trading the Volume Profile” linked above). These are all data driven prices and they are highly respected levels to some degree or another when price arrives for a retest.
So lets start off with a quick refresher from my previous article on identifying opportunities by framing the market for the following trading day. I ended the last article by showing a bit of this technique.
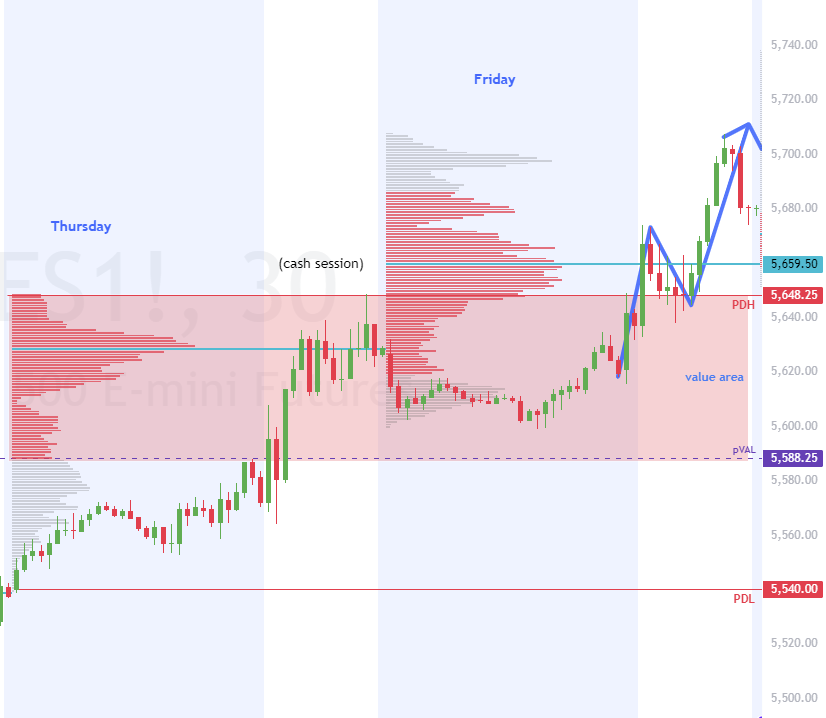
If you recall we ended with this example below. So this is the close of a Friday and we’re gearing up to frame out the potential scenarios for the following Monday and even into Tuesday.
To do this we look to the most recent relevant pricing data from Thursday and Friday to frame Monday’s trading session. But first lets recap Friday so we know what we’re dealing with. Friday’s overnight session sold off and pushed value below Thursday’s low. After that 30-ish point downward expansion, the market ran out of sellers, buyers stepped in and price reversed during the cash session pushing price all the way back through Friday’s overnight session and even back up into Thursday’s value area. Do you see that?
Friday was essentially a down trending “b” shape profile for the bulk of the 24hr day establishing value below Thursday. Sellers ran out of steam, buyers gained a foothold and rallied the market in the cash PM session, which created that high volume node just above Thursday’s POC or a weak “B” profile. Price ended the session and closed above this node/POC. Very bullish price action and closing structure in an overall weekly downtrend to end the week.
So what do we do with this information?
The answer is to use it. Ask yourself what do you want to see come Monday? What has to happen for you to engage your capital? Well for one, you’ll probably want some clarity. You want to qualify this late pm session surge as either a real move reversing the week’s downtrend or disqualify that move as an end of the week short covering that lifted the market (aka a fake move) temporarily. So how do you do that?
This is where the “IF/THEN” scenarios come into play. For you Excel guru’s out there you’ll know this well. Transpose that over to framing out tomorrow’s highly probable possibilities. Meaning IF this happens, THEN this is likely. IF that happens THEN likely that will take place.
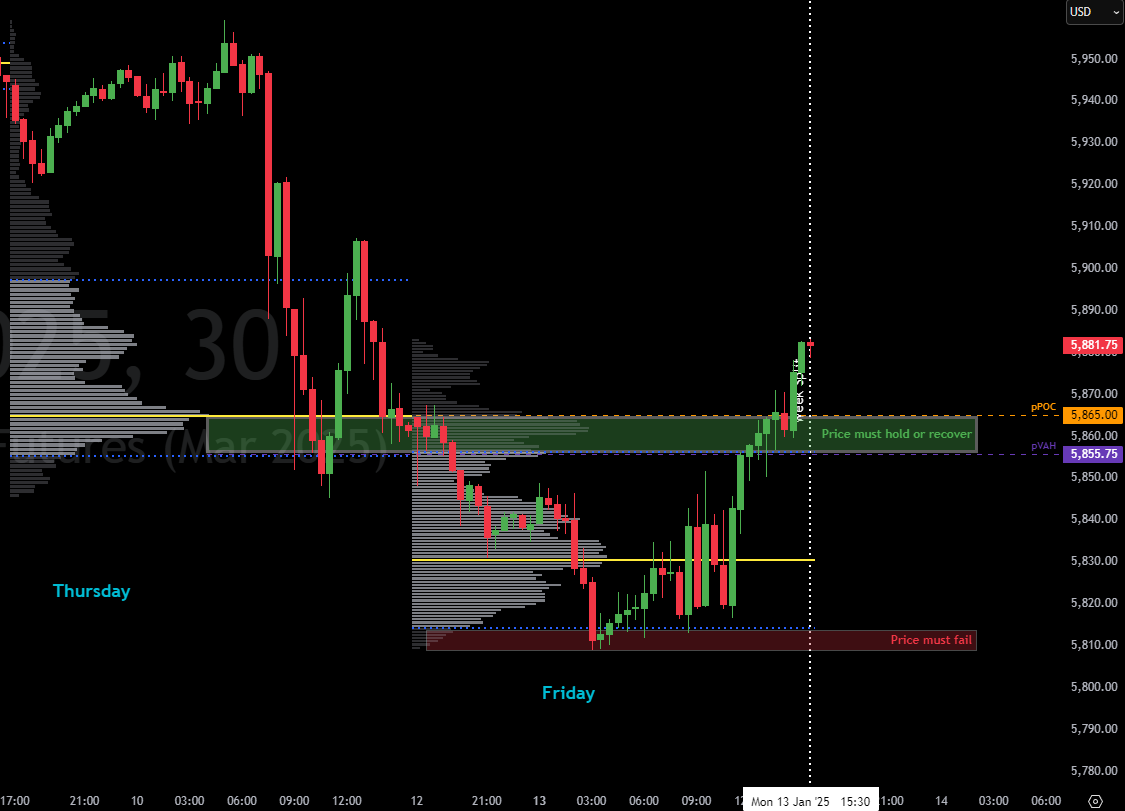
The green zone I’ve charted is the POC/VAL of Thursday, its basically open, just lightly tested at Friday’s closing surge. Did I just randomly choose this green zone POC/VAL? No. This is the low of the open Thursday value area where price closed into. Its the nearest data driven anchor to where price is trading.
This level needs to hold or quickly recover for price to move up, it can’t move up without doing so. So IF that green zone holds, THEN the next likely spot price is going to reach for is the value area high of Thursday, and if things get real bullish possibly that Thursday high. IF that level fails and price sells off, THEN the next likely spot down price will reach for is Friday’s POC or low. Did you catch all that?
So lets look at Monday’s session, did Thursday’s POC hold or not?
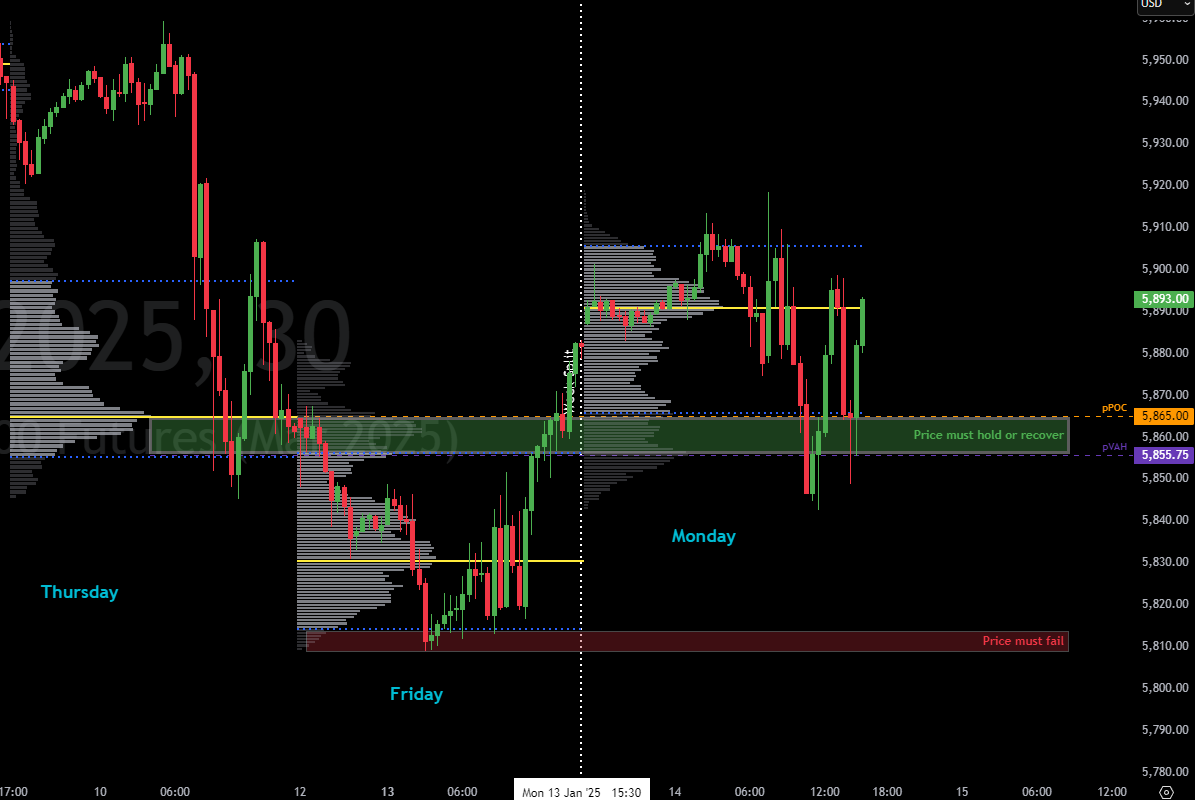
You can see price did end up holding Thursday’s POC/VAL (green zone). Early on, price retraced the late pm surge on Friday along with the overnight runup, quickly recovered & held the zone bouncing back up just shy of Thursday’s open VAH late in the session. Maybe you were able to frame a trade off that price action, maybe you weren’t. That’s not the point of this exercise at this time, we’re just reading the potential likely shifts of value. Regardless, move on and set up for the next day, but don’t leave the day without taking away the new information from the latest session. Monday shifted value above Friday’s value. Use that information.
So once Monday closes and you’re headed into Tuesday, the breakout and breakdown levels just shift in accordance with Monday’s new value. So if price continues to hold Thursday’s POC & VAL (now red zone) and bullishly breaks out of Monday’s VAH, then its likely price is going to move up to retest that Thursday high. If price fails that green zone and breaks down below Thursday’s POC/VAL (red zone) then its likely price will head back down to retest Friday’s POC and/or low. You follow that? Lets see what happened on Tuesday’s session.
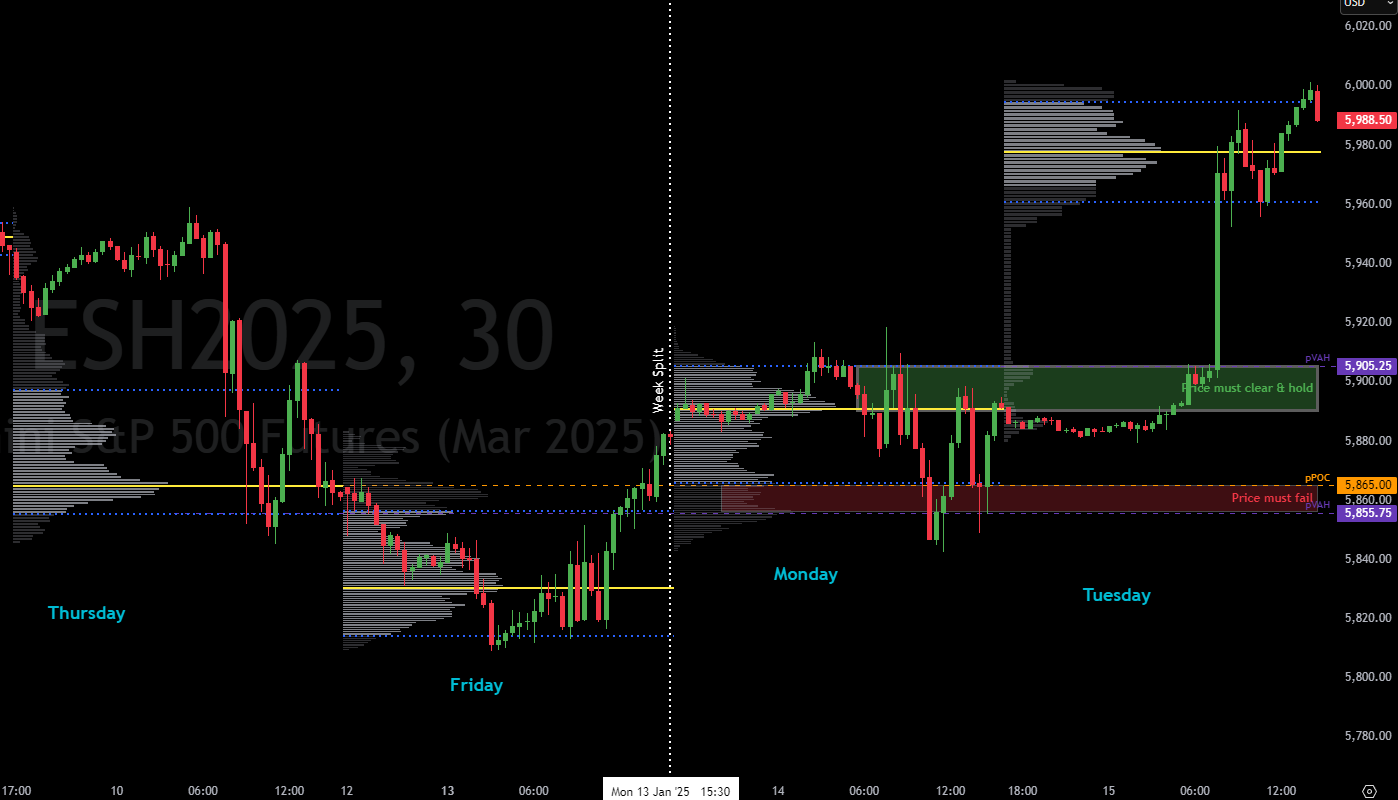
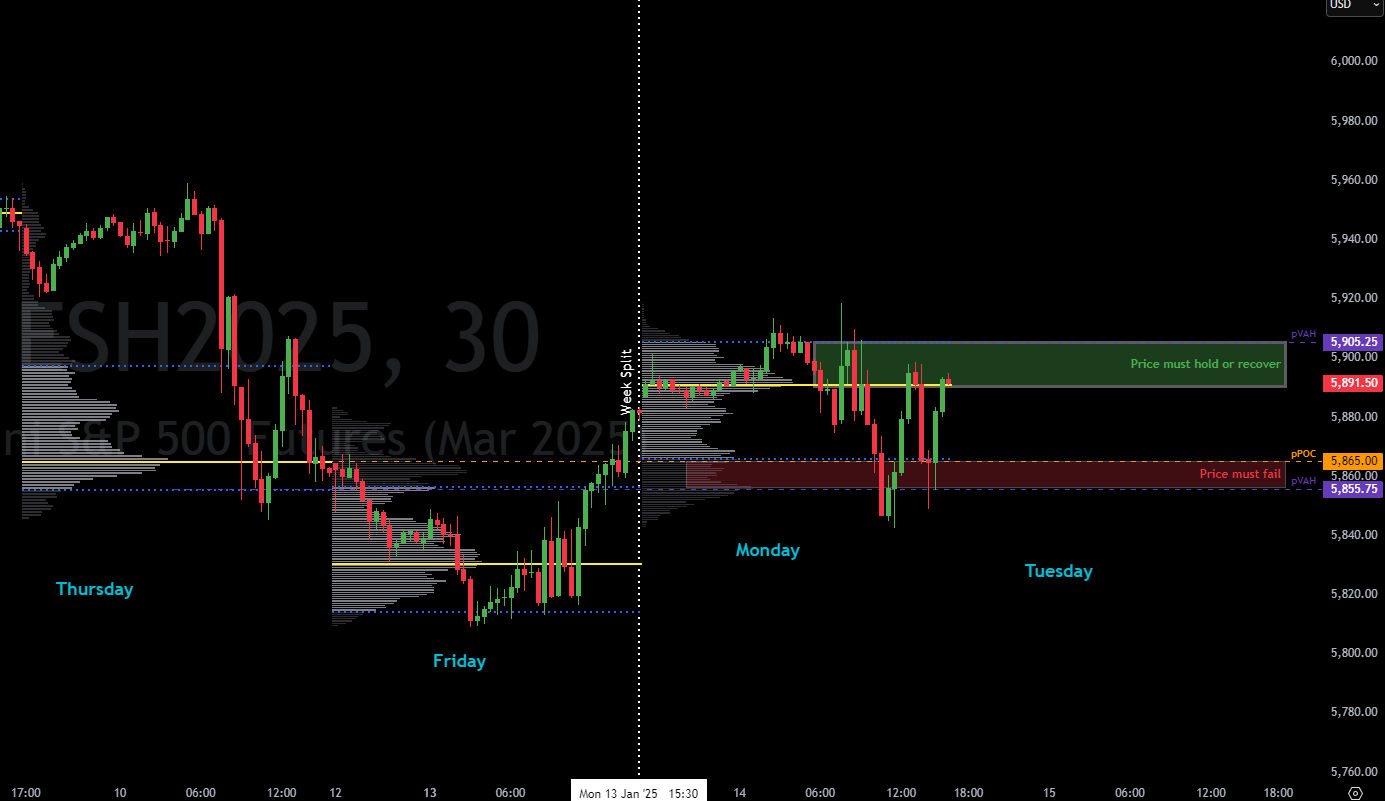
Okay so the overnight was essentially a very tight flat range, running up in the premarket right to Monday’s VAH, just before the bell. Note the pattern price made just before the breakout, I’ll come back to that later. Price violently broke out and ripped right to Thursday’s high. From there price established new higher value for the balance of the day, now up above Thursday’s high. As a note, this is an extreme breakout to illustrate the point and are not typical. This was probably some news driven event to cause this kind of rally.
That right there is the concept of value shifting. Look at the value area starting on Thursday, where it traveled to on Friday and into Monday and finally where it ended on Tuesday of the next week. If you can isolate the daily value areas and track and frame them correctly you’ll be in great position to identify setups going into these moves. Sometimes you’re not able to take a trade for a variety of reasons; time of day, breaking news or no structural setup forming and that’s okay, there will be another.
So let’s move on to the actual execution.
You have your day framed using the volume profile, you’ve patiently awaited price to arrive at your breakout/breakdown level and now price has arrived.
Now what are the specifics?
First thing you want to do is understand the market conditions, the volatility, the speed along with the broad and immediate trends. Are you operating in conditions that are ideal? And is your potential breakout/breakdown trade in alignment with the trend? Going contra-trend is not forbidden, but it does carry some added risk.
Okay, check, check, check. VIX isn’t crazy, speed of the market isn’t out of control, and the particular breakout/down trade is in alignment with both the broad and immediate trends. Going short in a down trend for example. Okay so what is the setup and what is the trigger?
Go back to the above example breakout. What pattern do you see just before the bullish rip on Tuesday morning? You see a bull flag breakout forming, breaking followed by ripping to the upside.
Lets look at another one to the downside.
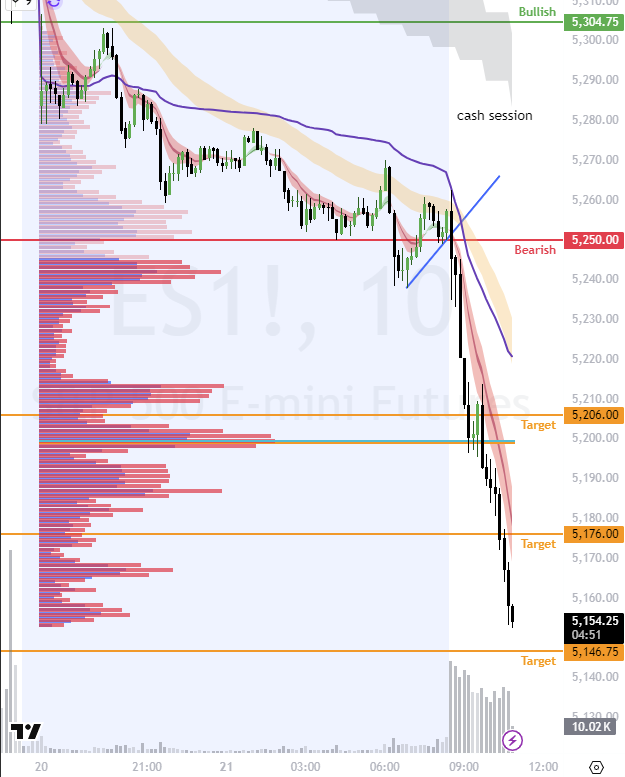
Here’s the setup heading into the day on the S&P futures. Bearish bias, bearish trends across the board, bearish gap down, bearish breakdown level met, bear flag setup formed (10m chart) right at the open. Price broke, held below the bearish level and then flushed to the downside shifting value lower.
How about another?
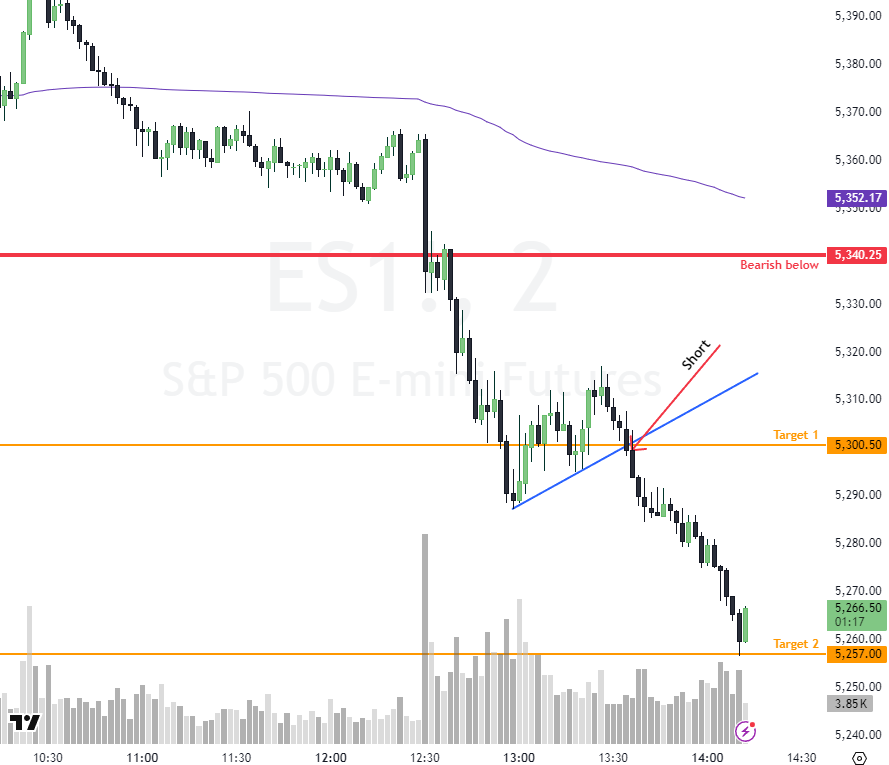
Similar setup on this day as well. Bearish breakdown to T1 where a bear flag setup broke for another leg down. Price broke the bear flag at the T1 level, and then pushed right to T2 shifting value even lower.
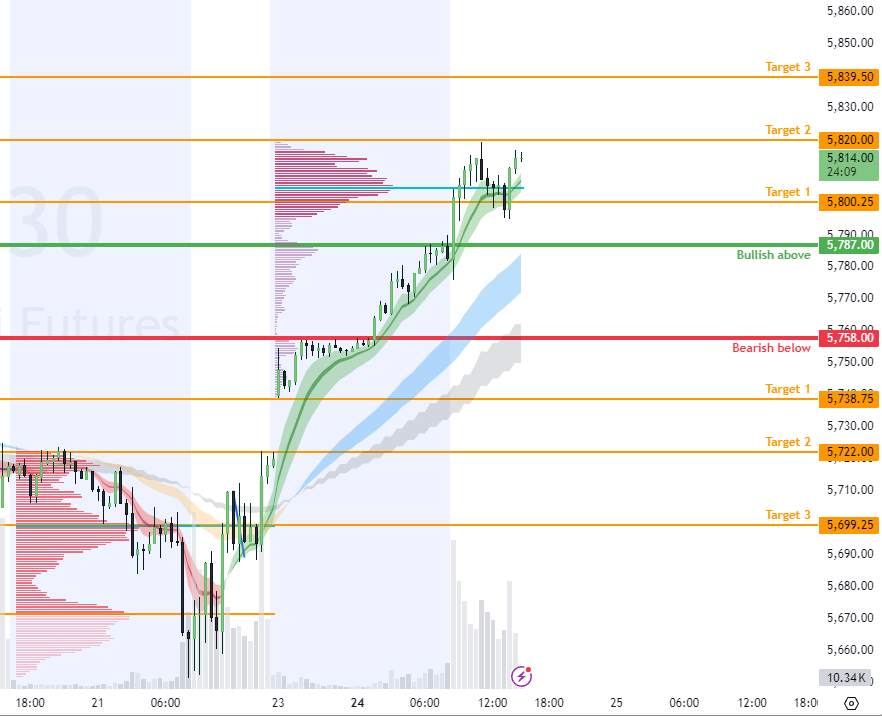
Let’s look at another. Here’s a bullish market, breaking out to the upside. Price gapped up on the overnight rallied 30 points before the bell, and broke the “bullish above” level nearly immediately. This was on a 30m chart, if you drill down to the 10m (which is my baseline setup chart) you’ll see yet another bull flag breakout pattern. Look at the “P” shape bullish profile and the value shifting up on the day.
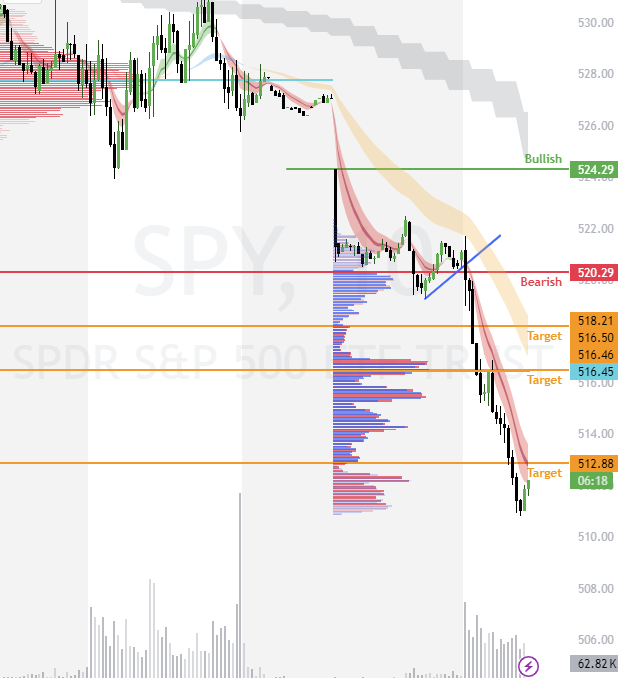
Don’t want to trade futures? No problem. Roll this technique over to the SPY. In the below example the 520 puts shortly after the open worked well, take your profits along the ride down.
In this strategy, once you’ve ID’d the value you’re working off of, you’re then looking for strength of buyers and weakness of sellers at bullish breakout levels and strength of sellers and buying weakness at the bearish breakdown levels to qualify the setup. As an example, bullish order flow, bullish price pattern, bullish inertia via the trends.
Assessing the order flow is a critical component of understanding what the buyers and sellers are doing at your levels where you’re a potential buyer or seller.
Okay, so we’ve covered a lot here. The main takeaways to understanding this technique is to understand the movement of value day to day. Frame that value and setup your next trading day with the highest possible breakout/breakdown setups and targets possible. And be ready to pull the trigger when price breaks.
In my next article, I’ll dive even deeper into this concept of the capturing a potential value shift and isolate out on the Order Flow footprint how to read the strength of buyers and sellers at these key levels to execute optimal entries. Hope this was helpful.
-Dan
None of this constitutes financial advice, these are merely my opinions, strategies and insights that I personally use to trade the S&P 500 and are for educational purposes only. This is not an offer or recommendation to trade futures, stocks, options or forex.
RISK DISCLAIMER: THERE IS A VERY HIGH DEGREE OF RISK INVOLVED IN TRADING. PAST PERFORMANCE IS NOT NECESSARILY INDICATIVE OF FUTURE RESULTS. ALL INDIVIDUALS AFFILIATED WITH THIS SITE ASSUME NO RESPONSIBILITY FOR YOUR TRADING AND INVESTMENT RESULTS. ALL THE MATERIAL CONTAINED HEREIN IS BELIEVED TO BE CORRECT, HOWEVER, TRADERDAN WILL NOT BE HELD RESPONSIBLE FOR ACCIDENTAL OVERSIGHTS, TYPOS, OR INCORRECT INFORMATION FROM SOURCES THAT GENERATE FUNDAMENTAL AND TECHNICAL INFORMATION. FUTURES AND FUTURES OPTIONS TRADING CARRIES SIGNIFICANT RISK. OPTIONS TRADING CARRIES SIGNIFICANT RISK. FOREIGN EXCHANGE TRADING CARRIES SIGNIFICANT RISK. STOCK TRADING CARRIES SIGNIFICANT RISK. TRADING SECURITIES, SECURITY OPTIONS, FUTURES AND/OR FUTURES OPTIONS IS NOT FOR EVERY INVESTOR, AND ONLY RISK CAPITAL SHOULD BE USED. YOU ARE RESPONSIBLE FOR UNDERSTANDING THE RISK INVOLVED WITH TRADING FUTURES, OPTIONS, STOCKS, AND FOREIGN EXCHANGE PRODUCTS. PRIOR TO TRADING ANY SECURITIES PRODUCTS, PLEASE READ THE CHARACTERISTICS AND RISKS OF STANDARDIZED OPTIONS AND THE RISK DISCLOSURE FOR FUTURES AND OPTIONS
THE INDICATORS, STRATEGIES, SETUPS, METHODS, AND ALL OTHER PRODUCTS AND FEATURES ON THIS WEBSITE ARE FOR EDUCATIONAL PURPOSES ONLY AND SHOULD NOT BE CONSTRUED AS ADVICE. INFORMATION FOR FUTURES TRADING OBSERVATIONS ARE OBTAINED FROM SOURCES BELIEVED TO BE RELIABLE, BUT WE DO NOT WARRANT ITS COMPLETENESS OR ACCURACY, OR WARRANT ANY RESULTS FROM THE USE OF THE INFORMATION. YOUR USE OF THE TRADING OBSERVATIONS IS ENTIRELY AT YOUR OWN RISK AND IT IS YOUR SOLE RESPONSIBILITY TO EVALUATE THE ACCURACY, COMPLETENESS, AND USEFULNESS OF THE INFORMATION.
YOU MUST ASSESS THE RISK OF ANY TRADE WITH YOUR BROKER AND MAKE YOUR OWN INDEPENDENT DECISIONS REGARDING ANY SECURITIES MENTIONED HEREIN. ANY PERSON WHO CHOOSES TO USE THIS INFORMATION AS A BASIS FOR THEIR TRADING ASSUMES ALL THE LIABILITY AND RISK FOR THEMSELVES
Thank you for this great content🙏